Table of Contents:
Forecast Module FAQ:
What does it do?
- The Forecast module is designed to help CPG brands predict future sales and demand, integrating both sales and trade promotion forecasting in one platform. Its core purpose is to provide a comprehensive, data-driven view of expected performance across products, customers, and timeframes, enabling smarter planning & resource allocation.
What benefits does it provide?
- It automates volume calculations, integrates multiple data sources (POS, shipment, ERP), and provides real-time updates. This reduces manual/offline work, increases planning accuracy, and allows for dynamic re-forecasting as assumptions, markets, and sales plans change.
Why would I use this?
- To improve forecast accuracy, align trade spend with sales expectations, optimize inventory, and ensure all teams (sales, finance, supply chain) are working from the same data-driven plan.
What roles in a company would use this?
- Sales, finance, demand planning, supply chain, and trade marketing teams all benefit from the module’s insights and forecasting capabilities
How/when would I use this as part of my broader trade spend management function?
- Use it to plan and simulate promotions, allocate trade budgets based on expected promotional lift, and monitor actual vs. forecasted results to refine future spend.
How/when would I use it as part of trade forecasting?
- Integrate promotional plans into sales forecasts to predict demand surges, avoid stockouts, and inform production and inventory decisions
Data Requirements:
What data does the Forecast module need to function?
- Historical sales data (POS), shipment data, store count/velocity, promotional calendars, and optionally deduction data for actuals vs. forecast analysis.
What specific type of POS data is required?
- Weekly or daily POS data by SKU and retailer, including units sold and store count (or average stores selling).
Is Deduction Spend required?
- Deductions are not required for basic forecasting, but recommended for full ROI analysis and reconciliation of planned vs. actual spend, allowing for further improvement in forecast accuracy
Do all Promotions created in Promotions Planning flow into the Forecast?
- Yes, all promotions in the following statuses are brought into the Forecast - Pending, Submitted, Approved, Running, and Completed Status.
- Only promotions in Cancelled or Declined status are excluded.
Basic Overview and Navigation of the Forecast Module:
Navigate
- Left-hand navigation bar, Insights > Forecast
Pivots
- Customer - Select individual customer and product list is populated below.
- Ideal for customer planning
- Product - Select individual product and customer list is populated below
- Ideal for new and/or discontinued items

View | Units, Revenue, Promotion, Lift, Seasonality, Stores, Velocity or Added Volume (in Units)
- Subtotal reflects selected metric
- Un-collapse for full view
- Displayed metrics (no manual editing allowed): units, revenue, promotion, lift, seasonality
- Adjustable metrics (manual editing allowed): stores, velocity, added units.
-
For ease of mass updating, select the metric you are editing (velocity, stores, added volume)
-
Unit of Measure | Units or Cases
Customer Type | Retailers, All-Other Buckets, Distributors
Group by | Week or Month
- Week - Week ending Sunday
- Month - Calendarized conversion. Weeks that cross months will be broken into daily averages and allocated to respective month volume
- Forecast export is formatted based on the time frame selected
Show empty rows | Toggle ON to show full product list (includes items with no volume)
- Turn on when adding new distribution
Customer Types:
Retailer
- Actualized Week: Determined forecast source (syndicated or ERP)
- Forecasted Week: Based on Retailer averaged week, determined in Account Settings OR via Manual Overrides
- Contains links to the Approved promotions falling into future weeks
- Inputs

- # of Stores Selling
- Base Velocity
- Added Volume (in Units)
All Other Buckets (AOB)
- Actualized Week: Distributor actuals - Retailer actuals
- Forecasted Week: Based on Retailer averaged week, determined in Account Settings OR via Manual Overrides

- Inputs
-
- Base Units
- Added volume
- TIP: Only create AOB for major distributors (UNFI, KeHE, DOT, etc.)
- TIP: Check AOB for every new forecast - major forecast swings often come from here
Distributor
- Actualized Week: ERP Actuals
- Forecasted Week: Retailer Forecast + AOB Forecast
- Inputs: None

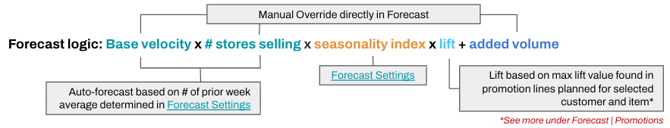
Forecast | Layout & Logic:
Actualized vs. Forecasted Weeks
- Actualized weeks are determined by the latest data uploaded in Business → Revenue
- IMPORTANT! All customers with the same data source will actualize based on the latest date uploaded. For example, if Sprouts is accidentally excluded from the last four week SPINS export, Sprouts will actualize the four weeks as 0 volume.
- First forecast week (assuming no manual override) will be calculated based on the average of the X weeks, determined in Forecast Settings. The average is extrapolated into all future weeks unless manual override exists
Loading Actualized Lift
- Vividly weeks end Sunday. Ensure you are uploading full weeks of data or Vividly will assume that the partial week is fully actualized
- Example: 6/30/2025 is a Monday. If ERP data through Jun 30th was uploaded, the entire Week-End 07/07/25 will actualize with only one day of data. Thus, upload through June 29th

- Note that Nielsen data ends on Saturday
- Example: 6/30/2025 is a Monday. If ERP data through Jun 30th was uploaded, the entire Week-End 07/07/25 will actualize with only one day of data. Thus, upload through June 29th
Manual Overrides
- Manual Overrides are indicated with the Blue icon
- Any pre-existing overrides for those fields will be replaced
- Overrides are extrapolated into all future weeks unless, another manual override exists
- IMPORTANT Manual Overrides are overridden with actualized weeks, except for store count
- Uploaded values will apply to the version selected; no impact on prior versions
Ways to Add/Remove Manual Overrides | Watch a Video Tutorial Here
- Input directly in cell; remove by clicking on Blue icon

- Check the items or customers for bulk updates
- Upload via Excel (template available - max 5MB)
- Forecast overrides do not affect actuals
- TIP: Navigate to the Upload module to find our standard template template

Added Volume
- Manual Overrides are indicated with the Blue icon
- Most commonly used for pipefill and customers with irregular ordering patterns
- Allows you to account for irregular ordering without skewing your velocities for the year

Master Data & Settings
Link to the Vividly Forecast Settings Page
Link to Article - Forecast Settings: Overview
Generate a new Forecast to bring in any updates made outside the Forecast
- New or modified promotions (including lift updates)
- Revenue uploads
- Customer profile changes (Link to Article - Configure the Customer Profile for Forecasting)
- Pricing updates
- WARNING! Set an admin responsible for generating a new forecast at regular intervals. Generating a new forecast when others are also in the forecast will force everyone to work in the prior version and their changes will not be reflected in the new forecast
Seasonality Seasonality Index Tutorial
Annual Routine
- Make sure you take time to review and carry over any manual overrides into the new year (you’ll need to toggle between years)
- Use bulk manual override to zero out all shipment based retailer forecasts (ex: Costco if you forecast in truckloads rather than consumption)
- Then add in your forecasted volume, either:
- Store count = 1; base velocity = shipment units; added volume = 0
- Store count = 0; base velocity = 0; added volume = shipment units
Troubleshooting & FAQs
If your newly generated forecast is significantly different from the prior version:
- Ensure revenue uploads included all forecast retailers - creating an automated L4W report template within your syndicated account minimizes this issue
- For shipment based retailer forecasts, make sure Vividly stays updated with order timing (ex: if Costco shipment is pushed to the next month, and you don’t update your manual overrides, that volume will be lost when actualized weeks updates volume to 0)
- Review your All Other forecasts - set manual overrides of 0 for SKUs that too high (when shipment > consumption) or too negative (when shipment < consumption)
- Check that new items have pipefill planned and manual overrides for velocity/door count growth for at least the first 8 weeks of distribution
- Review your forecast settings if there are any systemic changes to trends
- If sales are growing or softening beyond expectations for more than 12 weeks, you may want to reduce your lookback period for retailers or AOB
- Leverage the seasonality index to accommodate the systemic changes