
Purpose & Navigation
The ROI Analysis Table helps you evaluate promotion performance, specifically measuring incremental impact and return on spend.
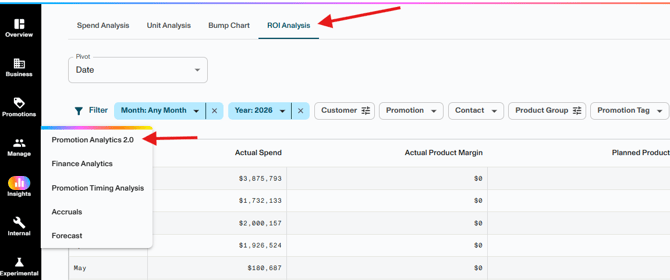
To access the ROI Analysis Table, go to Insights > Promotion Analytics 2.0 > ROI Analysis.
What Is ROI Analysis?
ROI Analysis is a report within Promotion Analytics that helps brands evaluate the financial return on their promotional investments. It answers a single but critical question: Did this promotion actually drive value?
Vividly defines value as a positive return — meaning the promotion generated more incremental profit than it cost to run. Unlike reports that measure spend or volume in isolation, ROI Analysis connects trade spend, incremental volume, and product margins in one unified view, giving brands a complete picture of promotion-level profitability.
ROI Analysis is not just retrospective — it functions as a feedback loop. It allows teams to compare what they expected versus what actually happened, and use those insights to improve future promotion planning.

- Expected ROI — calculated from planned lift and expected incremental sales. Available as soon as a promotion is planned.
- Actual ROI — calculated from actual lift (via POS/syndicated data) after a promotion is closed. Reflects true post-event performance.
Note: ROI Analysis is an advanced analytics feature. It requires a feature gate to be enabled on your account. Contact your Customer Success Manager if ROI Analysis is not visible under Insights > Promotion Analytics 2.0.
Who Should Use ROI Analysis?
- Sales Teams Sales teams use ROI Analysis to understand which promotions drove the most velocity, incremental volume, and revenue. For sales-focused use, product margin is typically set to 1 (100%) so the report reflects pure volume and revenue impact — without introducing profitability complexity or exposing sensitive cost data.
- Finance Teams Finance teams use ROI Analysis to evaluate true profitability. For finance-focused use, product margins must be calculated accurately (using actual COGS and list price) to measure whether each promotion generated incremental profit net of trade spend.
Important: Whether to include actual product margins in ROI Analysis is an organizational decision, not a technical one. It directly determines who in your organization sees profitability data and how the results are interpreted. Discuss with your team before configuring margins to ensure the right people have access to the right level of detail.
Why ROI Analysis Matters?
In CPG, trade spend is one of the largest investments a brand makes — but also one of the least consistently measured. Teams often rely on gut feel or fragmented reporting to make promotion decisions.
ROI Analysis in Vividly unifies planning, execution, and financial outcomes in a single system, enabling brands to:
-
Evaluate promotion-level profitability without building external spreadsheets
-
Identify which promotions are worth repeating — and which are not — based on actual return data
-
Support annual planning by surfacing your highest-ROI events from the prior year, and duplicating them directly from within the screen as templates for future activities
-
Ground post-event analysis in real data — actual spend is driven by cleared deductions in DRM; actual ROI uses real POS/syndicated data
-
Compare expected vs. actual performance at the promotion level to identify where planning assumptions need to be updated.
"ROI is only as good as the inputs. If any of these are missing or incorrect, the output becomes unreliable." — Product margins, list price, lift, and trade spend must all be accurate for ROI to be meaningful.
Prerequisites for ROI Calculation
To ensure ROI is calculated correctly, the following conditions must be met:
- Promotions must be in a Closed status
- Lift must be enabled
- Product Margin must be populated
- Set at the Product Group or Product level
- Can be set to 1 (100%) if needed
- Pricing must be accurate
- Configured at the Customer + Product Group level
- Applies to First Receiver + Direct Customer only
- Promo type must include:
- In-store dates
- Lift (required field)
ROI Setup (Back-End Configuration)
Before analyzing ROI, ensure your backend configuration is complete and accurate. This includes setting up product margins, pricing, lift, and promotion structure.
Watch the walkthrough below for step-by-step setup:
Data Availability Notes
- Actual ROI is only available for customers with syndicated data (uses actual lift)
- ROI is calculated at the total promotion level
- It does not change when viewing individual promotion lines
How to Interpret ROI
- Positive ROI (> 0): Promotion generated more profit than it cost
- Negative ROI (< 0): Promotion cost exceeded incremental profit
- Break-even (0): Spend equals incremental profit
- N/A:
- Promotion is not closed, or
- Product margin is missing
ROI Calculations
Primary ROI Formula
-
ROI = ((Revenue - COGS) - Spend) / Spend
ROI (Less COGS)
-
ROI = Incremental Product Margin / Actual Spend
Incremental Product Margin
-
Incremental Product Margin = Actual Units × (Lift / (1 + Lift)) × Performance Ratio × List Price × Product Margin
-
Note:
- Lift and Product Margin should be expressed as decimals
- Example: 40% = 0.4
- Lift and Product Margin should be expressed as decimals
Supporting Calculations
- Performance Ratio
= In-store window (days) ÷ Buy-in window (days) - Incremental Units
= Actual Units × (Lift ÷ (1 + Lift)) × Performance Ratio - ROI (Less COGS)
= (Incremental Units × Product Margin × Price) ÷ Total Promotion Cost - ROI (Gross Sales)
= (Incremental Units × Price) ÷ Total Promotion Cost
Field Definitions
| Field | Definition |
|---|---|
| Total Actual Spend | Total deductions tied to the promotion |
| Expected Incremental Revenue | Expected Lift × Total Expected Units × List Price |
| Actual Incremental Revenue | Incremental Units (from syndicated data) × List Price |
| Product Margin (Value) | Incremental Revenue × Product Margin % |
Best Practices: Closing Promotions
Promotions should only be closed when:
- The majority of deduction spend is expected
Once a promotion is closed:
- Additional deductions cannot be matched unless reopened
Recommended tools:
- Promotion Timing Analysis
- Deduction Timing Analysis
These help determine the optimal closing timing by customer.