
Summary
Note: Finance Analytics is a legacy module that is being phased out. While it remains available for existing users, we recommend using Budget 2.0, which offers improved functionality and continued support. This article is provided for reference for teams still using Finance Analytics.
Finance Analytics helps you track revenue, trade spend, and trade rate (%) across all your customers — direct, indirect, and distributors — in one place. It is especially valuable for understanding trade rates for indirect customers (retailers who receive your product through a distributor), where revenue isn't available from your ERP and must be estimated using uploaded POS data and configured list prices. For direct customers and distributors, revenue flows in from your accounting source uploads instead.
It is located at Insights → Finance Analytics.
Fields And Pivots
Filters

-
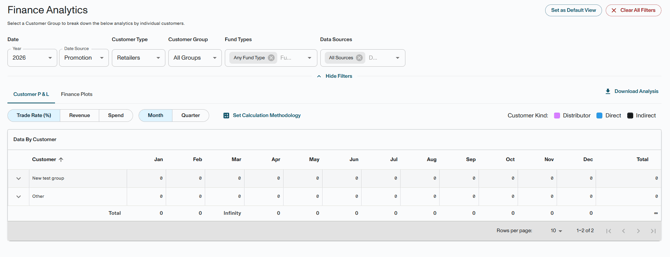
Year: Filters data by calendar year.
-
View By (Month / Quarter): Switches the time breakdown in the table.
-
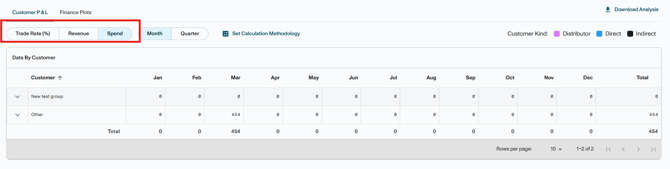
Metric Toggle (Trade Rate / Revenue / Trade Spend): Changes the primary metric shown.
-
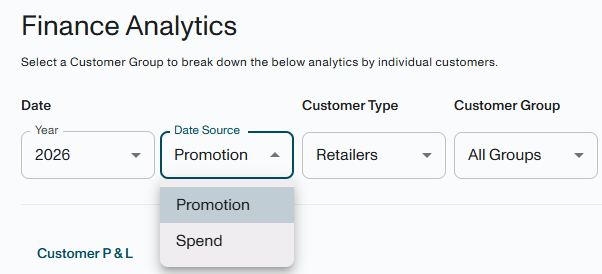
Date Source (Spend vs Promotion): Controls when trade spend is shown.
-
Data Source: Switches between accounting source (direct customers/distributors) and syndicated/POS data (retailers). If a customer is both direct and through a distributor, use this filter to avoid double counting revenue.
-
Customer Groups: Filters by P&L customer groups configured in Manage → Customers.
-
Fund Types: Filters by trade type or fund type.
-
Default View: Saves your current filter selections as your default each time you open the page.
Pivots: Customer P&L Tab and Finance Plots
-
Revenue: Estimated using POS units × list price for indirect customers; sourced from accounting uploads for direct customers.
-
Trade Spend: Actual (cleared deductions) or estimated (planned promotions), depending on Date Source.
-
Trade Rate (%): Trade spend ÷ revenue — the core metric showing how much of each revenue dollar goes to trade.
-
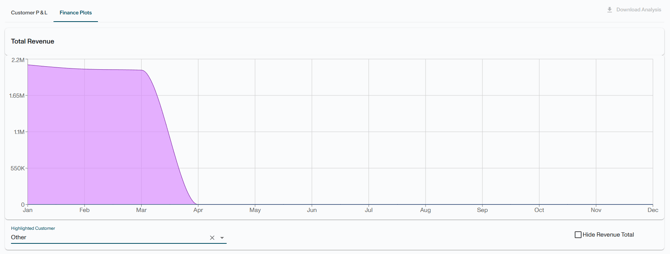
Finance Plots Tab: Displays a revenue trend chart comparing a selected customer against total company revenue.
Data Flow
Finance Analytics pulls from:
-
Planning: Planned spend (when Date Source = Promotion)
-
Business → DRM: Cleared deductions (when Date Source = Spend)
-
Business → Revenue Dollars: Direct customer/distributor revenue
-
Business → POS Data: Indirect customer unit sales
-
Manage → Pricing: List prices for revenue estimation
-
Manage → Products: Product codes for POS data matching
-
Manage → Customers: Alternative names and P&L groupings
Understanding Date Source: Spend vs Promotion
-
Spend: Shows deduction dollars in the month that were actually received. Best for finance teams tracking real cash flow.
-
Promotion: Maps deduction dollars back to when the promotion ran. Best for sales teams evaluating promotion performance.
Uploading Data Into Finance Analytics
Finance Analytics requires POS data (e.g., SPINS) to estimate revenue for indirect/retail customers.
-
Go to Business → Revenue Dollars and click "Load from File."
-
Upload your POS export file and select the data source.
-
Map the file columns to Vividly fields and resolve any flagged errors.
Before uploading, confirm:
-
Products have the correct UPC or item codes in Manage → Products.
-
Customers have the correct alternative names in Manage → Customers (e.g., the geography name used in your file).
-
Pricing is configured in Manage → Pricing — the system multiplies units × list price to estimate revenue.
Setting Up Customer Groupings
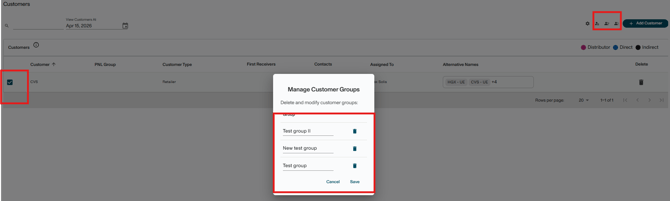
Group related retailers together to view a combined trade rate (e.g., all Albertsons divisions in one row).
-
Go to Manage → Customers.
-
Select the customers to group using the checkmark selector.
-
Click "Group for P&L" and name the group.
Colored dots will appear next to grouped customers. To ungroup, remove the group assignment from the same screen.
Calculation Methodology: Pass-Through Distributed Spend
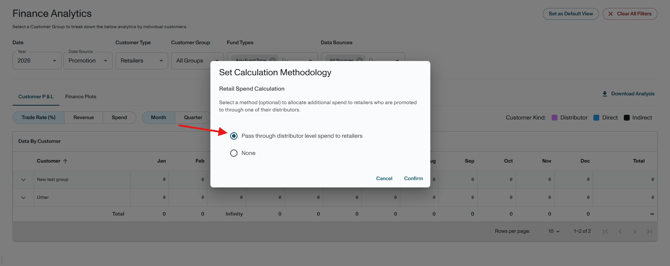
When a distributor-level promotion exists in Vividly (e.g., a 10% MCB across UNFI), Finance Analytics can trickle that spend down to the individual retailer level for a more accurate trade rate view — without requiring a separate promotion per retailer.
How it works: The system takes the per-unit discount from the promotion (e.g., $0.10/unit) and applies it to every unit sold in the consumption data within that promotion's date range. It is not an exact allocation, but it provides a reliable estimated trade rate at the retailer level.
To configure:
-
Go to Accout Settings → Deductions and Revenue
-
Scroll down to Trade Rates - Promotion Type Pass Through section
-
Select which promotion types you want passed through.
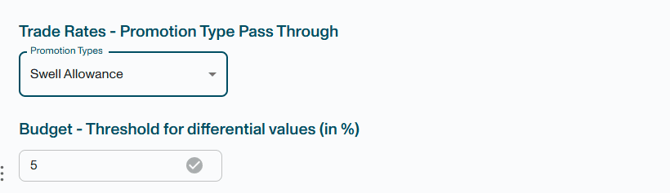
Only the selected types will be reflected in individual retailer trade rates in Finance Analytics.